HYROX first came across my radar in late 2024, when my sister signed up for a doubles race in Melbourne. I started seeing the sport everywhere on social media, so I did what I usually do with something new and went to PubMed to learn more about it. There was nothing. Plenty on CrossFit, a reasonable amount on obstacle course racing, and not a single paper on HYROX, which seemed strange for an event so many people were already training for. So I wrote a review of what could reasonably be inferred from related sports (5). It was published in early 2025, before I had raced a HYROX myself.
A lot has changed since then. I’ve now completed a handful of HYROX races, the first studies on the sport have started to appear, and with Dan Plews and Paul Laursen I’ve published a small pilot dataset of my own (1). Between racing and collecting data on HYROX athletes, some of what I wrote in that review has shifted.
The clearest example is how I thought about the stations. In the review I framed them as a largely anaerobic problem, with maximal strength, power and local muscular endurance as the qualities that decide them. That isn’t wrong, exactly: heart rate and blood lactate do run higher on the stations than on the runs (2). But the race as a whole is far more aerobic than I gave it credit for, and inadequate aerobic fitness will limit your ability to get through the stations just as much as inadequate strength, if not more. Strength is better understood as an entry requirement: you need enough of it that the stations become sub-maximal, and beyond that point, more of it won’t continue to reward you. The rest of this article is about how I arrived at that view, and what it means for training.
The critical speed framework
I like the critical speed (or critical power) model more than any other way of thinking about HYROX, because it maps onto the race so well. Briefly: if you plot how hard someone can go against how long they can keep it up, you get a curve that drops steeply and then flattens out. The flat part is critical speed. Below it, the muscle can reach a steady state and hold it for a long time. Above it you’re drawing on a finite reserve, usually called work prime (W’), and once that reserve is spent you slow down or stop (3). Athletica has a good explanation of this on its critical power page, so I won’t repeat it here.
In a continuous event like a marathon, you can sit just under that line for the whole race. HYROX does not let you do that. Each station pushes you above the line, some by a little and some by a lot (in the heart-rate trace Dylan Scott shared with me for the review, the burpee broad jumps looked like the worst offender), and the 1 km run that follows is the only place you can get back under it and recharge. That is the structure of the race in a sentence: the runs are where you recover from the stations, and you can only recover if you’re running below your own critical speed.
The margin for error is tight. Consider two athletes, A and B, who run every kilometre of the race at the same pace and lose the same amount of reserve on each station. For A, that pace sits exactly on critical speed. For B, whose critical speed is a touch higher, the same pace sits a few seconds per kilometre below it. Through the first three stations they’re indistinguishable: both arrive with a full reserve, both spend a chunk of it on the ski erg and the sleds, both run the next kilometre at the same split. The difference is hidden inside the runs. B is under the line, so part of what each station took is restored before the next one. A is on the line, so nothing comes back, and each station draws from a reserve that is never topped up. By the burpee broad jumps A has little left to spend, and from there the only option is to do the stations slower: losing time on the rower, putting down the kettlebells during the farmers carry, letting the wall ball drop at rep 30. The runs may still look fine on the split sheet; the stations are where the time goes (Figure 1). That’s the person whose wall balls turn into a seven-to-ten-minute ordeal instead of the three or four minutes the top athletes take. I see it in every race, and I’ve definitely been that person myself.
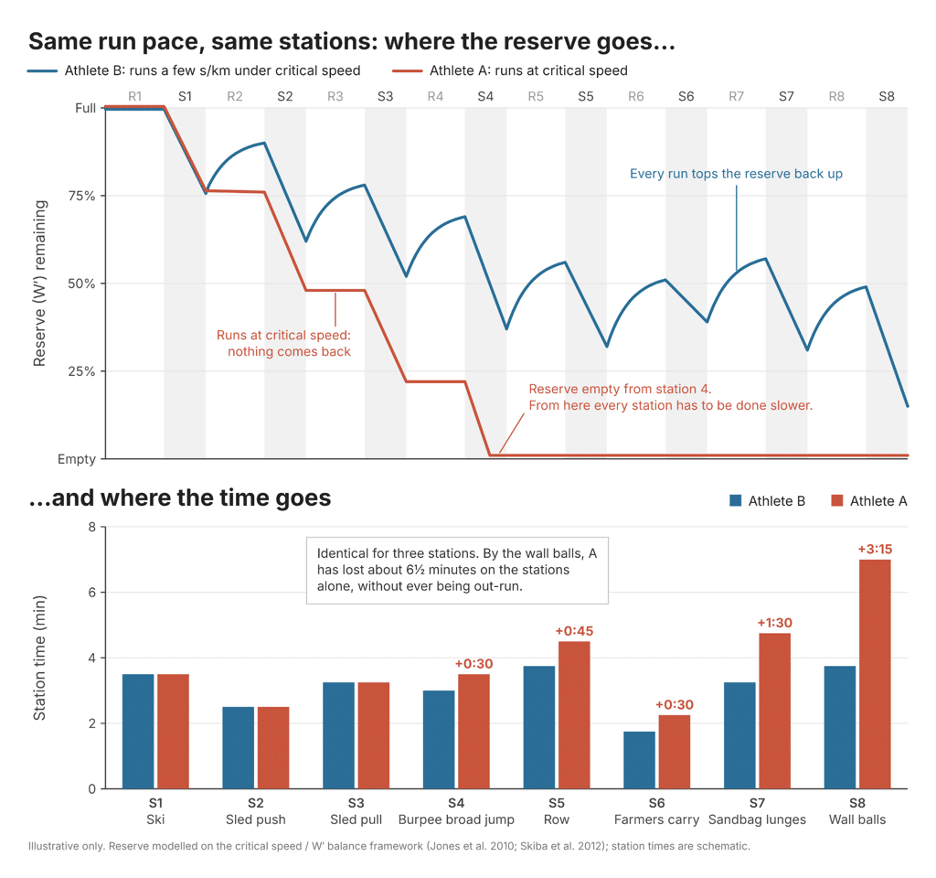
FIGURE 1: Illustrative reserve (W’) balance (3, 8) for two athletes completing identical stations at identical run paces, one at critical speed and one a few seconds per kilometre below it; station times are schematic.
What the pilot study found
A few weeks before my own review article was published, Brandt and colleagues (2) published the first ever study on HYROX. They put eleven recreational athletes through a simulated race and found that VO2max was the strongest predictor of finishing time (ρ = -0.71). That sat comfortably with my own thinking at the time, which had aerobic capacity as a key determinant. But two features of the study left the bigger question open. Their group was broad, with VO2max ranging from 47 to 72 ml/kg/min, and across a range that wide VO2max will always separate the fast from the slow. And VO2max was the only endurance parameter they measured. Lactate threshold and running economy, the other two pillars of the endurance model, weren’t assessed, and tellingly their measures predicted running time but not station time. So the pilot study was designed to track all three in a more homogeneous group of athletes, and to ask what separates them once the aerobic ceiling is roughly the same.
We recruited eight trained male HYROX athletes, most of them racing Pro, and had them come into the lab to complete a VO2max test, a lactate threshold test and a running economy measure, then matched each athlete to their most recent official race result (1). Unlike Brandt’s cohort, the group was homogeneous on purpose. VO2max only ranged from 50 to 57 ml/kg/min, so the ceiling was close to the same for everyone, and whatever separated the faster athletes from the slower ones had to be something else.
A quick word on categories, because they change what the numbers mean. Almost everyone races Open, which is roughly 90 to 95% of all results on the HYROX database (6). Pro is the same course with heavier stations: for men the sled push goes from 152 to 202 kg, the sled pull from 103 to 153 kg, the farmers carry from 2 x 24 to 2 x 32 kg and the wall ball from 6 to 9 kg, with women’s Pro weights sitting at the men’s Open loads (5). Anyone can enter Pro, there’s no qualifying standard, and it’s where most of the serious age-groupers end up. The Elite 15 is different: 15 men and 15 women who have to qualify, racing Pro weights at a handful of invitation events through the season, with the world champion crowned from that field. So when I say most of the Elite 15 would clear the strength benchmarks, or that our pilot athletes were mostly Pro, that’s the Pro weights I mean. Doubles and relay formats split the stations between athletes and have their own loads, and nothing in this article applies cleanly to them.
The key number that best predicted HYROX performance in this group was running speed at the second lactate threshold, which is about the closest thing a lab test gives you to critical speed. It was the strongest correlate of total race time (r = -0.81) and explained roughly 65% of the variance, which in this group worked out at about six minutes of race time for every 1 km/h of threshold speed. The part I didn’t expect was that it also tracked station time on its own, with all the running stripped out (r = -0.77), and so did fractional utilisation, the percentage of VO2max an athlete can hold at threshold (r = -0.70). The part of the race that looks like a strength test, and the part Brandt’s measures couldn’t account for, was following an aerobic measure.
The most likely explanation is the one the framework predicts. The athlete with the higher threshold is less stressed by each run, arrives at each station with more reserve to spend, and refills it faster before the next one. Over eight stations that adds up. VO2max itself didn’t correlate with anything in our group, but I wouldn’t read much into that. It’s the flip side of Brandt’s result: across a wide range VO2max has to discriminate, and within a narrow one it can’t. Put the two studies together and the picture is consistent. Once everyone is reasonably fit, VO2max stops separating people and the threshold underneath it starts to.
The obvious limitation is the sample. Eight people is a pilot, the confidence intervals are wide, and we can’t say anything causal. In its defence, the result fits the intensity-domain physiology that has been established for decades in continuous sports (3), it fits what I see on the floor, and it has given us a clean hypothesis to test in a bigger group, which we’re now doing in the lead-up to HYROX Melbourne at the end of this year.
Max strength and muscular endurance
This is the part I didn’t explain so clearly on the podcast, so it’s worth drawing (Figure 2).
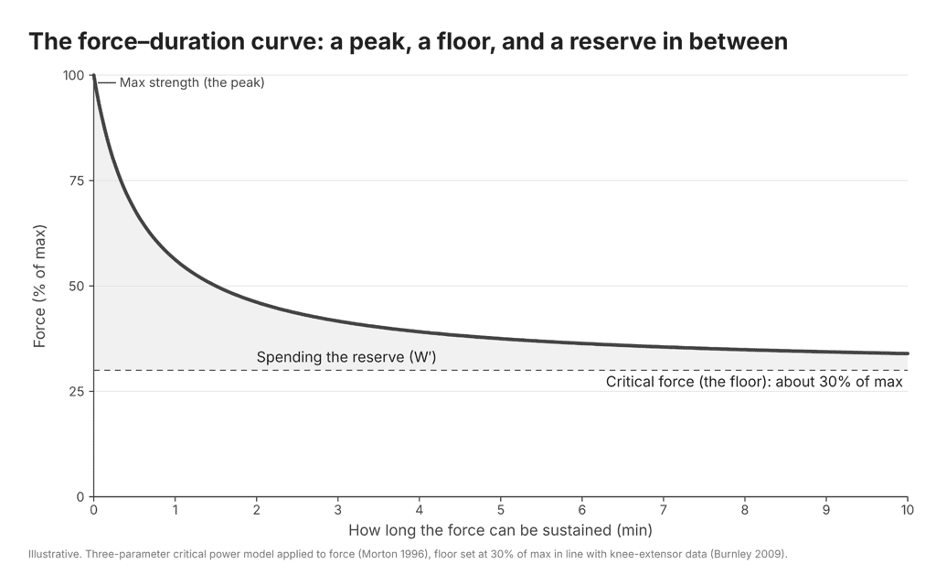
FIGURE 2: Illustrative three-parameter critical power model applied to force (7), with critical force set at 30% of max in line with knee-extensor data (4).
Strength, in the broadest sense, is the capacity to produce force. The catch in HYROX is that the capacity gets measured over 55 to 70 minutes with nowhere near enough recovery between efforts, so the question is never just how much force you can produce but how much of it you can keep producing. If you plot force against how long a muscle can sustain it, you get the same shape as the speed curve. The top is your max strength. The flat part at the bottom is critical force, the highest force the muscle can sustain, which for the knee extensors tends to sit at roughly 30% of max (4). Hold 50% of your max and you’d be forced to stop after about a minute and a half. Anything above the floor is spending a reserve, exactly like running above critical speed.
The reason I think this matters is that nothing in a HYROX race is anywhere near your max. A 20 or 30 kg sandbag is maybe 20 to 30% of a reasonable squat, and the wall ball is lighter than that. What the stations actually ask is for you to hold a fairly low force for three or four minutes, already tired from everything that came before, without the quads giving out. That’s a critical force problem, and I think it’s the most specific physical quality in the sport. It’s also the one I got wrong when I started. I came into HYROX with a reasonable back squat, around twice my bodyweight, and the assumption that max strength would take care of the stations: the stronger you are, the smaller a fraction of your capacity each rep of a fixed load represents, so the longer you should last. That logic holds for an isolated effort of a minute or two. Look at the figure below and you can see why. Raising the peak lifts the curve most at the short end, and the floor doesn’t move. But a solo HYROX gives you almost no chance to recover, so what’s really being asked is to keep producing force for 60 to 70 minutes, and out there the floor matters far more than the peak (Figure 3).
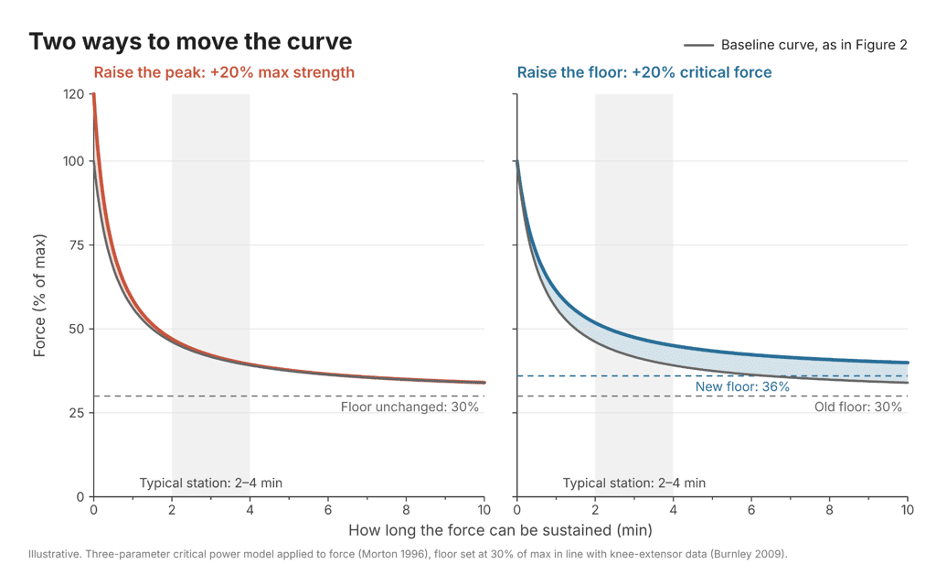
FIGURE 3: Two ways to move the curve; raise the peak or raise the floor.
The figure also answers the question I get asked most, which is how strong you need to be. The curve gives two different answers depending on which end of it you move. Raise max strength by 20% and the whole curve lifts, but the gain is largest for short, heavy efforts and shrinks as the effort gets longer, because critical force hasn’t changed and is now a smaller fraction of a bigger max. Raise critical force by 20% instead and the gain grows as the effort gets longer and doesn’t fade. A sled push mostly needs the first. A hundred wall balls at the end of the race mostly need the second.
So I’ve come around to thinking of max strength as a requirement rather than a goal. You need enough of it that the sleds are sub-maximal, and without that the race falls apart at the sled. It’s what happens to a lot of runners and triathletes who come across to HYROX: fine on the first kilometre, then they meet a sled with 150-plus kilos on it. Benchmarks get thrown around, something like a 1.5 times bodyweight back squat and a 0.75 times bodyweight overhead press; to be clear, these are rules of thumb rather than anything rooted in HYROX data yet, although most of the Elite 15 would clear them. Past that point the returns diminish, and the extra mass it takes to keep adding max strength probably starts to cost you on the half of the race that is running (6). That trade-off, strong enough to move the sled but light enough to run, is the central problem for the hybrid athlete. Once the requirement is met, the curve says the better investment is raising the floor rather than the ceiling. Over 60 minutes, the stronger athlete is the one who can keep producing force, not the one with the biggest single rep.
Two curves, one problem
Writing the review, I treated running and the stations as two separate problems with two separate sets of qualities. I now think they’re the same problem described twice. Critical speed is the line between sustainable and unsustainable for the runs. Critical force is the same line for the stations. Both mark the intensity at which a steady state becomes impossible and a reserve starts draining, and I’d expect both to rest on similar machinery in the muscle: mitochondria, capillaries, and the capacity to clear what the stations produce.
Which raises a question I keep coming back to. If threshold speed explains two thirds of race time on its own, would critical force explain a good portion of what’s left, particularly on the stations? Could the two together account for most of a HYROX result? I don’t know yet. The two measures probably overlap a fair bit, and at this stage it’s a hypothesis rather than a finding. But it’s testable, so my larger upcoming study will include a measure of critical force alongside more typical measures of muscular endurance, such as a max wall ball effort. As far as I know it will be the first time anyone has measured both lines in the same HYROX athletes.
It would also fit what the race data show at the top end. Across seven seasons of Pro and Elite results, running takes up about half the clock, but it’s on the stations rather than the runs that the time between athletes mostly opens up (6). Whether that’s threshold doing its work through recovery, or critical force, or both, is exactly what measuring the two together should tell us.
What I’d change in training
The practical consequence, at least for me, is less about which exercises you do and more about where the next block of training effort goes.
The first thing is to find out where your threshold actually is. A lab test is the gold standard and it’s what we used, but a critical speed estimate from your own running data gets you most of the way, and that’s what Athletica builds from your training history. The runs, in training and in the race, should then sit a few seconds per kilometre below it. Not on it. Slightly under it, because that gap is what lets the reserve refill. The complication is that most venues are indoors with no GPS, so you have to learn what that pace feels like outside with a watch and then carry the feeling into the race. In my own racing I aim for a seven or eight out of ten on the runs, and never a ten. Even on the final run. Although it is tempting to push a little harder on that final lap, giving yourself that extra 5-10 seconds to complete the 1km may save you 30+ seconds getting through the 100 wall balls.
The second is to build max strength until the sleds feel sub-maximal, and then stop chasing it. That block belongs early in the year, when you’re furthest from racing. After that, the strength work should move down the curve: lower loads, sets that last two to four minutes, quads first, in positions that look like the stations. The point of those sets is to raise the floor, not the ceiling, so the question to ask of each one is whether it’s making you better at sustaining force, not whether the number on the bar went up. I’ve been using blood flow restriction for a lot of this, because it loads the metabolic side of a set without the mechanical cost, but that’s a separate post.
The third is to practise the station-to-run transition, because trying to hold a target pace on legs that have just pushed a sled is unlike anything else I’ve done, except maybe the bike-to-run in triathlon, and the only way to get better at it is exposure. The stations that hit the quads hardest are the ones to pair with a run: a sled push at or above competition weight, or a set of sandbag lunges, followed by 500 to 800 m at race pace. You don’t need the full kilometre. The first few hundred metres, getting your breathing back under control, is the part that matters.
I’m not arguing against lifting. Most of the people I meet in the sport are either below the strength requirement and getting beaten up by the sleds, or above it and still chasing a bigger squat because that’s the thing they know how to progress. The curve suggests both groups are working on the wrong end of it.
Technique matters too, and I underplayed it in the review. Hinging on the sled pull and the rower saves the quads for the push, the lunges and the wall balls, and the best people in the Elite 15 are worth watching on the stations because that efficiency is years in the making. But technique decides how far above the line a station takes you. Where the line sits is physiology, and that’s the thing you can train.
HYROX is described as the sport where you need to be good at everything. I’d put it more narrowly than that now. You need a high threshold for the runs and a high floor for the stations, and most of your training time should go to whichever one is holding you back.
Ready to put the science into practice?
Athletica builds your critical pace from your own training data and prescribes HYROX sessions around it
Frequently asked questions
- What is critical speed and why does it matter for HYROX? Critical speed is the fastest pace you can hold in a metabolic steady state. Above it you draw on a finite reserve (W’) that only refills below it. In HYROX the stations push you above that line eight times and the 1 km runs are the only chance to recover, so running just under your critical speed is what keeps you fresh for the stations.
- How should I pace the runs in a HYROX race? A few seconds per kilometre under your threshold or critical speed, not on it. Learn that pace by feel in outdoor training with a watch, because most venues are indoors without GPS. Aim for roughly a seven or eight out of ten effort on each run.
- How strong do you need to be for HYROX? Strong enough that the sleds feel sub-maximal. Common rules of thumb are around a 1.5 times bodyweight back squat and a 0.75 times bodyweight overhead press, although these aren’t yet backed by HYROX data. Beyond that level, extra max strength gives diminishing returns and the added mass can slow your running.
- What is critical force? Critical force is the highest force a muscle can sustain without progressive fatigue, around 30% of maximum for the knee extensors. It marks the same boundary between sustainable and unsustainable work that critical speed marks for running, and it’s probably the most specific strength quality for HYROX stations such as wall balls and lunges.
- Is muscular endurance more important than max strength for HYROX? Once you have enough max strength to move the sleds, yes. Raising max strength mostly helps short, heavy efforts. Raising critical force (muscular endurance) helps more as efforts get longer, which is what the stations demand.
- Can one test predict HYROX performance? Not fully. In our pilot, running speed at the second lactate threshold explained about 65% of total race time in trained men. Pairing it with a critical force measure may explain much more, which is what the next study is testing.
- Does grip strength matter for HYROX? Brandt and colleagues found no relationship between grip strength and HYROX time (2). Grip can limit the farmers carry, but it doesn’t predict overall performance.
References
- Davids CJ, Plews DJ, Laursen PB. Lactate threshold speed and fractional utilisation as key correlates of HYROX performance in trained males. Sport Perform Sci Rep. 2026;319(v1). https://sportperfsci.com [CHECK: final URL]
- Brandt T, Ebel C, Lebahn C, Schmidt A. Acute physiological responses and performance determinants in Hyrox: a new running-focused high intensity functional fitness trend. Front Physiol. 2025;16:1519240. https://doi.org/10.3389/fphys.2025.1519240
- Jones AM, Vanhatalo A, Burnley M, Morton RH, Poole DC. Critical power: implications for determination of VO2max and exercise tolerance. Med Sci Sports Exerc. 2010;42(10):1876-1890. https://doi.org/10.1249/MSS.0b013e3181d9cf7f
- Burnley M. Estimation of critical torque using intermittent isometric maximal voluntary contractions of the quadriceps in humans. J Appl Physiol. 2009;106(3):975-983. https://doi.org/10.1152/japplphysiol.91474.2008
- Davids CJ. A performance analysis of HYROX: a review of the physiologic, mechanical, and technical demands. Strength Cond J. 2026;48(1):88-100. https://doi.org/10.1519/SSC.0000000000000913
- Rappelt L, Wiedenmann T, Held S, Heinke L, Micke F, Wicker P, Donath L. Longitudinal performance development in PRO and ELITE HYROX competitions across the first seven competitive seasons. Front Physiol. 2026;17:1847569. https://doi.org/10.3389/fphys.2026.1847569
- Morton RH. A 3-parameter critical power model. Ergonomics. 1996;39(4):611-619. https://doi.org/10.1080/00140139608964484 (figure model)
- Skiba PF, Chidnok W, Vanhatalo A, Jones AM. Modeling the expenditure and reconstitution of work capacity above critical power. Med Sci Sports Exerc. 2012;44(8):1526-1532. https://doi.org/10.1249/MSS.0b013e3182517a80 (figure model)