Qatar 2022 Football World Cup Running Analysis: Group Stages Part 1
In this short blog, we summarize the highest physical performers across the group stages of the 2022 Qatar Football World Cup. Although we understand the limitation of such “cherry-picked” data, we believe it is still interesting to examine what the top players in each position cluster are doing, as well as compare these across positions.
Where does this data come from ?
During the World Cup 2022 in Qatar, FIFA used semi-automatic tracking systems such as Tracab, Hawk-Eye, Genius or Bepro to measure all the running parameters of players. This technology, certified by the FIFA, is based on several cameras set all around the pitch, enabling an analysis of all the player positions at 25 hz. We received data for all players across all matches, and were able to analyze the following parameters:
- Overall total distance covered (Figure 1)
- Sprints (total distance covered >25km/h) (Figure 2)
- Top speed (km/h) (Figure 3)
What does the data show us ?
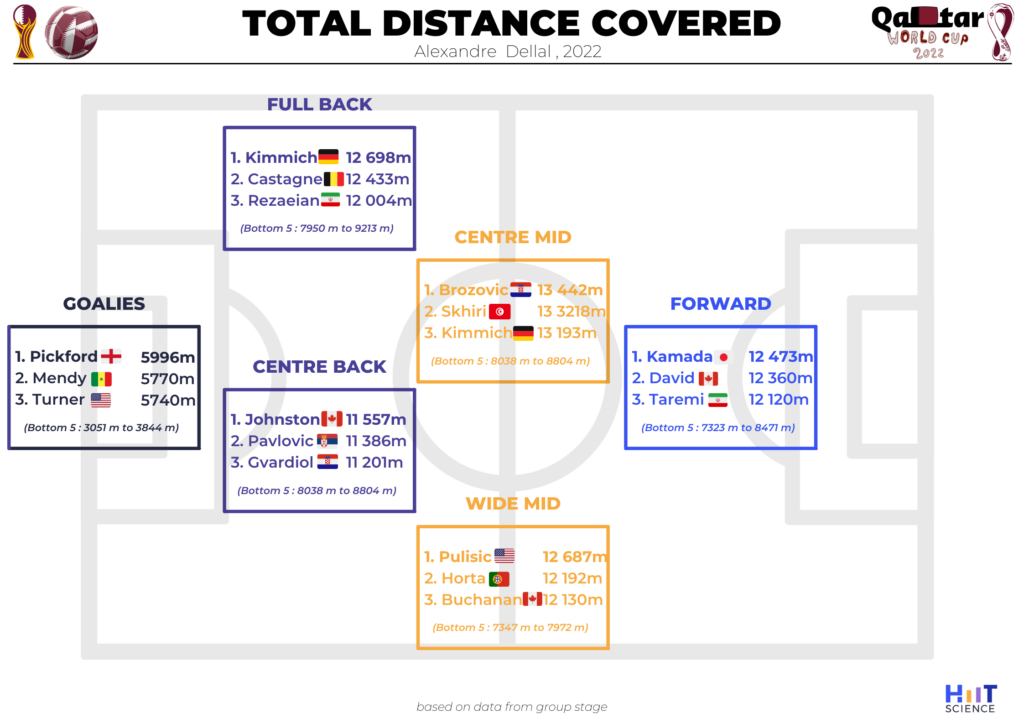
Figure 1: Top performing players for total running distance covered during the group stage matches at the Football World Cup 2022 in Qatar.
Total distance covered (Figure 1)
Goalkeepers ran almost half of what the rest of their teams did. Even when we compare the “bottom 5” performances for each position, we see a similar trend. Although it is by now well established that goalies are running much more than the common fan might expect, this is still an impressive number.
While the center backs (defenders) had the lowest total distance covered from all the in-field players, they had the smallest range from the bottom 5 to the top 3 (8034 to 11 557m). Does that make them the most balanced or efficient runners at this world cup during the group stage? We don’t know, haha!
The rest of the positions show a strong similarity in how much they ran over the course of all the group matches. The full backs and wide midfielders show almost the same distance covered, but when we look at the bottom 5 performers, the full backs clearly outran the wide midfielders (7950-9213m vs 7347-7972m).
Although we know that modern football is very dynamic and players move fluently between positions, the data from this world cup further confirms: forwards ain’t lazy! Oh, and those Canadians must have found some sort of secret sauce (we are guessing it is the maple syrup – how can it be though?! EVERYONE says nowadays carbs are bad!!!).
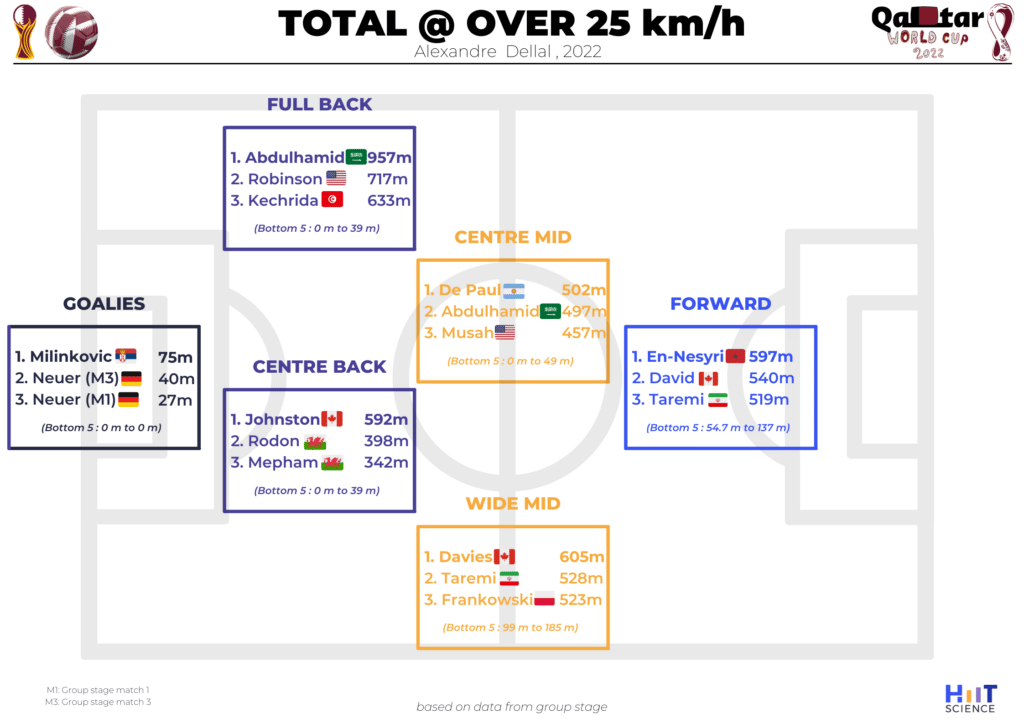
Figure 2: Top performing players for total running distance over the speed of 25 km/h covered during the group stage matches at the Football World Cup 2022 in Qatar
Total @ over 25 km/h (Figure 2)
First things first: Germany does not always win, although Neuer seems to have some sort of special enjoyment going FAST. It does align well with him being a staple in the group of goalies who have pushed the “12th” man play style of modern goalkeepers.
Now it gets somewhat interesting:
The full backs had clearly the highest performers, but none came from teams that have performed “exceptionally well” during the group matches. If we look at the range, the bottom 5 performers show us that the wider range of full backs had a somewhat “easy going” attitude. In terms of the bottom 5, the full backs got clearly outperformed by their wing-mates in the midfield, the center midfielders and even the forwards – yeah, that is everyone.
As before, the final difference between the other positions is rather small. The players on the outside of the pitch do run more meters at high speeds than in the center. No biggie here – BUT oh Canada again… so we can confirm that Jonathan David will get this EPL spot, Davies a raise at Bayern and Celtic did make the right call on Johnston!
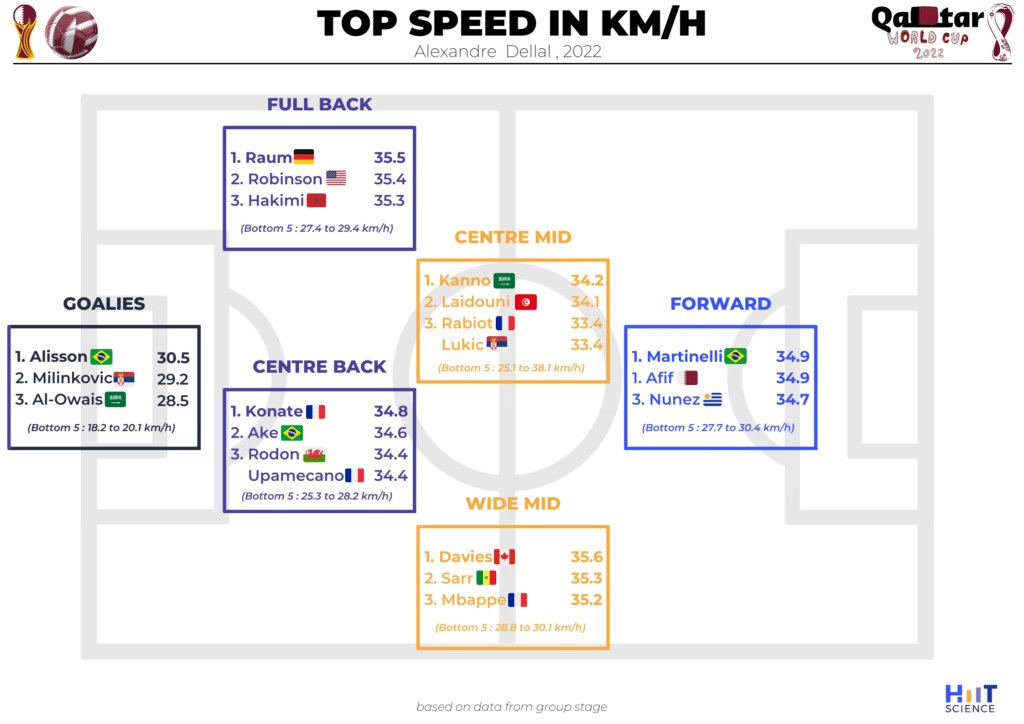
Figure 3: Top performing players for top running speed in km/h during the group stage matches at the Football World Cup 2022 in Qatar.
Top Speed in Km/h (Figure 3)
Ok, so let us be clear: EVERYONE ran fast. Yes, we dare you to put the treadmill at the gym the next time to 20 km/h and see for how long you can keep up with the bottom 5 performing goalies.
Once more, the differences seem to disappear even more. There was barely any stand-outs here. Yes, the full backs redeemed themselves for their rather disappointing “bottom range” at high speeds, and slightly outperformed everyone else, but otherwise you pretty much needed to have a 34 km/h top speed to be competitive.
Obviously, we don’t know here for how long that speed was sustained or how fast the players accelerated into that area. Thus, there is little we can tell. But we do know now that Canada has a weakness! They are not the “fastest” – ha! We knew there was a reason why they did not perform that well.
Why is this interesting ?
- It is always fascinating to know what the “top” physical performances are in football. For years we have seen tactical and strategy trends being reflected in what, where and how much players are running. Here we see another world cup that points into an “amalgamation” of how much players run and how the differences from position to position is shrinking
- Despite this being data pointing on individual performances, we are looking forward to analyzing this with greater care and detail to strategic choices, but also relative to match situations (e.g. just before goals) to look at the relevance and specificity of the performances – because after all, who wants to waste all those precious “fast” meters on situations that have no impact?
- As world cups only happen once every 4 years, teams shuffle massively and only have a short time for preparation (even though they play across those 4 years). We look forward to comparing this data with the positions and players respective “regular” game data (from their leagues), as well as across previous world cups.
What are the limits of these data ?
- Context: it is essential to understand that only 3 group matches were played, and teams obviously played only the teams in their own groups, and no specific analysis of relevant match situations has been performed here – all this limits the level comparison that can be made between teams, players and their performance
- Tactical and technical analyses are also required because they directly impact the physical activities during a game – such analysis could be related to running parameters just before goals were scored, as well as relative to the chosen fielding strategy, or even the current position of the team in the group
- Interpretation of this data is particularly difficult, as it mainly focuses on individual performance, without considering any of the contextual factors mentioned above. For practical recommendations, there is a plethora of more more relevant parameters (medians, ranges, direct head-to-head comparison within matches etc.) that need to be further analyzed
Summary
To conclude, the data presented are interesting and impressive to look at, but has obviously clear limitations from what we can do with it in practice. Thus, we are looking forward diving into a deeper analysis so we can use it for our daily management of players and teams alongside workload, recovery and injury prevention strategies. Back to work!
About the authors
Dr Marcin Lipski – Eccentric Exercise Expert, Exercise Science Researcher
Science Translator & Multimedia Creative @ HIIT Science
Exercise & Sport Scientist for Esports Wellbeing and Performance @ FITGMR
Alexandre Dellal – Coach UEFA Licence A, Strength & Conditioning in Soccer, Sport Science Researcher; formerly Olympic Lyon and OCG Nice
FIFA Medical Centre of Excellence, Centre orthopédique Santy, Lyon, France
LIBM Laboratoire Interuniversitaire de Biologie de la Motricité