Preamble
We became aware that the study described in this blog might not see the light of day for various reasons. Due to its novelty (world class athletes, field-based testing, etc.), we invited Marco to publish his data here on our HIIT Science Blog and in SPSR, as it reveals a practical and convenient way to monitor individual athlete adaptation to altitude training. We also believe that Marco’s findings may prove to have a link with those described in the last two blogs. Regardless, we hope the work inspires researchers to dig further into this area and address the limitations to the research Marco identifies. If you want more details on the work, please visit Marco’s researchgate profile.Introduction
As described in Chapter 9 of HIIT Science, resting heart rate (HR) and heart rate variability (HRV) have long been used to monitor an athlete’s training status and recovery from previous workouts (1, 2, 3).The rationale behind monitoring recovery using resting HR or HRV is that heavy training shifts the autonomic nervous system towards a sympathetic drive (4), reflected in higher resting HR and lower HRV within 24h to 48h after training.In particular, reductions in HRV and increases in HR, as measured at rest first thing in the morning, have been reported the day after high intensity aerobic exercise across a wide range of individuals (5, 6, 7). While most studies have focused on the relationship between HRV and training load (8, 9), less work has been completed in the applied setting examining the relationship between HRV changes and training adaptation or performance (10, 11, 12, 13). Obviously, such data would be of great practical interest to coaches and applied scientists. Training camps provide a unique opportunity for coaches to manipulate various training-related variables in an attempt to trigger specific adaptations that may result in improved performance. Specifically, environmental variables are often the key manipulation factor for such camps, and particularly altitude or heat. While the rationale behind training at altitude is clear and well documented, with an increase in red blood cells and improved oxygen carrying capacity resulting from spending time in a hypoxic environment, athletes often respond differently and not always positively.
Some athletes seem to adapt and improve, while others appear to struggle or require more time to adapt (14, 15, 16).A typical pattern of positive adaptation to an altitude camp shows submaximal exercise HR initially higher for a given exercise level, but gradually lowers to sea level values by the end of the training camp (17). On the other hand, a lack of adaptation results in submaximal exercise HR levels similar to the ones of the first week at altitude even at the end of the training camp (18).
Additionally, changes in submaximal exercise HR during an altitude camp have shown the strongest relationship with running performance (19), hence making submaximal exercise HR an ideal candidate to track an athlete’s response to the training camp.In this work, due to a lack of performance data, we relied on submaximal exercise HR data to determine responders and non-responders to an altitude camp. In particular, we identified responders as athletes whose speed to heart rate ratio showed values similar to sea level by the end of the camp, as covered in detail in the Methods section.
An important question coaches ponder when they supervise their athletes in an altitude training camp is: Wouldn’t it be useful to have real-time evidence to know whether an athlete was adapting to the training at altitude?From Chapter 9 in HIIT Science we know that the measurement of morning resting HRV can provide a simple, non-invasive assessment of how an athlete is dealing with the novel stressors imposed by the training camp (e.g. increased training load, traveling, spending time at altitude, etc.) and could allow coaches the insight to further adjust training plans at the individual level (11, 16, 20). However, little data is available in the context of individual responses in elite triathletes, and particularly to the response at altitude.
Thus, the purpose of this study was to determine whether changes in resting HR and HRV during the beginning of a 3-week training camp at altitude would be representative of training adaptation at the end of the training camp in elite triathletes.In particular, we hypothesized that a favourable adaptation profile in terms of resting physiology would be reflected by a smaller or absent increase in resting HR, a smaller or absent reduction in HRV and smaller or absent variation in HRV when going from sea level to altitude (20). Our rationale was based on the idea that a lower perturbation in homeostasis, resulting in a less exacerbated change in resting physiology, is typically representative of a positive response to a stressor, and associated with improved performance outcomes in other sports (10, 20).
Materials and Methods
Participants and data acquisition
Four elite triathletes (2 male and 2 female), spent 23 days in Namibia at 1655 meters of altitude for two consecutive years in January 2019 and January 2020, providing a total of N = 7 individual responses to the training camp (data for 1 athlete in 2019 was missing). All athletes involved in the study had been National Champions (at either junior, under 23 and / or Elite level). HR and HRV measurements at rest were taken using the validated HRV4Training app, which showed trivial differences and almost perfect correlation with ECG for 1-minute measurements at rest (21).The HRV4Training app is a commercially available mobile phone app (22) which allows for non-invasive measurements of HR and HRV (rMSSD) using either the phone camera, or an external sensor.The triathletes were instructed to take measurements daily first thing in the morning upon waking, while lying in bed and breathing naturally (self-paced). Measurements were collected consistently for approximately two years.
Defining adaptation – training camp responders vs. non-responders
Athletes were grouped into responders and non-responders to the training camp at altitude based on the relationship between HR and speed at submaximal intensity (velocity to heart rate ratio) at the end of the training camp. In particular, responders were athletes whose velocity to heart rate ratio at the end of the camp reached sea level values. Our rationale for use of this methodology was the following: In an acute exposure to a hypoxic environment, a higher cardiac output is shown at any workload (23). However, after acclimatization, the relationship between heart rate and workload re-normalizes to sea level values (24). Additionally, training adaptation can be identified from submaximal exercise HR data, where a typical pattern of positive adaptation shows submaximal exercise HR initially higher for a given exercise intensity (17), with gradual reductions to sea level values (18).Thus, in our study, we considered responders the athletes who were able to positively adapt within the duration of the camp.In particular, running data collected from TrainingPeaks were used to determine the velocity to HR ratio, a marker of aerobic endurance. Additionally, in this case, the marker was used to indicate training adaptation, since HR at a given velocity is expected to rise for an athlete during the initial phase of the camp at altitude, and to subsequently reduce as a sign of positive adaptation (hence the opposite behaviour of the velocity to HR ratio, as shown in Figure 1). Running data was pre-processed as follows: all workouts without velocity and heart rate data were excluded. Very short workouts in which an athlete might have not reached a steady state in terms of heart rate were excluded (workouts shorter than 25 minutes). Workouts with low average heart rates, typically caused by sessions involving short intervals and long breaks, and therefore not representative of aerobic capacity, were also excluded. Finally, given the potential issues due to sensor malfunction and simply the fact that anything can happen outside of the lab, we used an additional filter that removed workouts outside of the 15th and 85th percentiles, so that outliers in terms of the relation between velocity and heart rate would be excluded. The velocity to HR ratio over the filtered workouts was averaged each week, prior to using the concept of the smallest worthwhile change (SWC), computed as 30% of the standard deviation in the ratio between velocity and heart rate, for an individual athlete, to determine responders vs. non-responders (25).
We used 30% of the standard deviation as typically recommended in the literature when analyzing within-individual data (26).This means that if the velocity to heart rate ratio during the last week of the training camp was within the SWC of the velocity to heart rate ratio during the week before the camp (at sea level), the athlete was considered to be a responder. If the ratio was still outside of the SWC, the athlete was considered to be a non-responder, as HR was still elevated to a greater degree relative to their normal day to day variability.
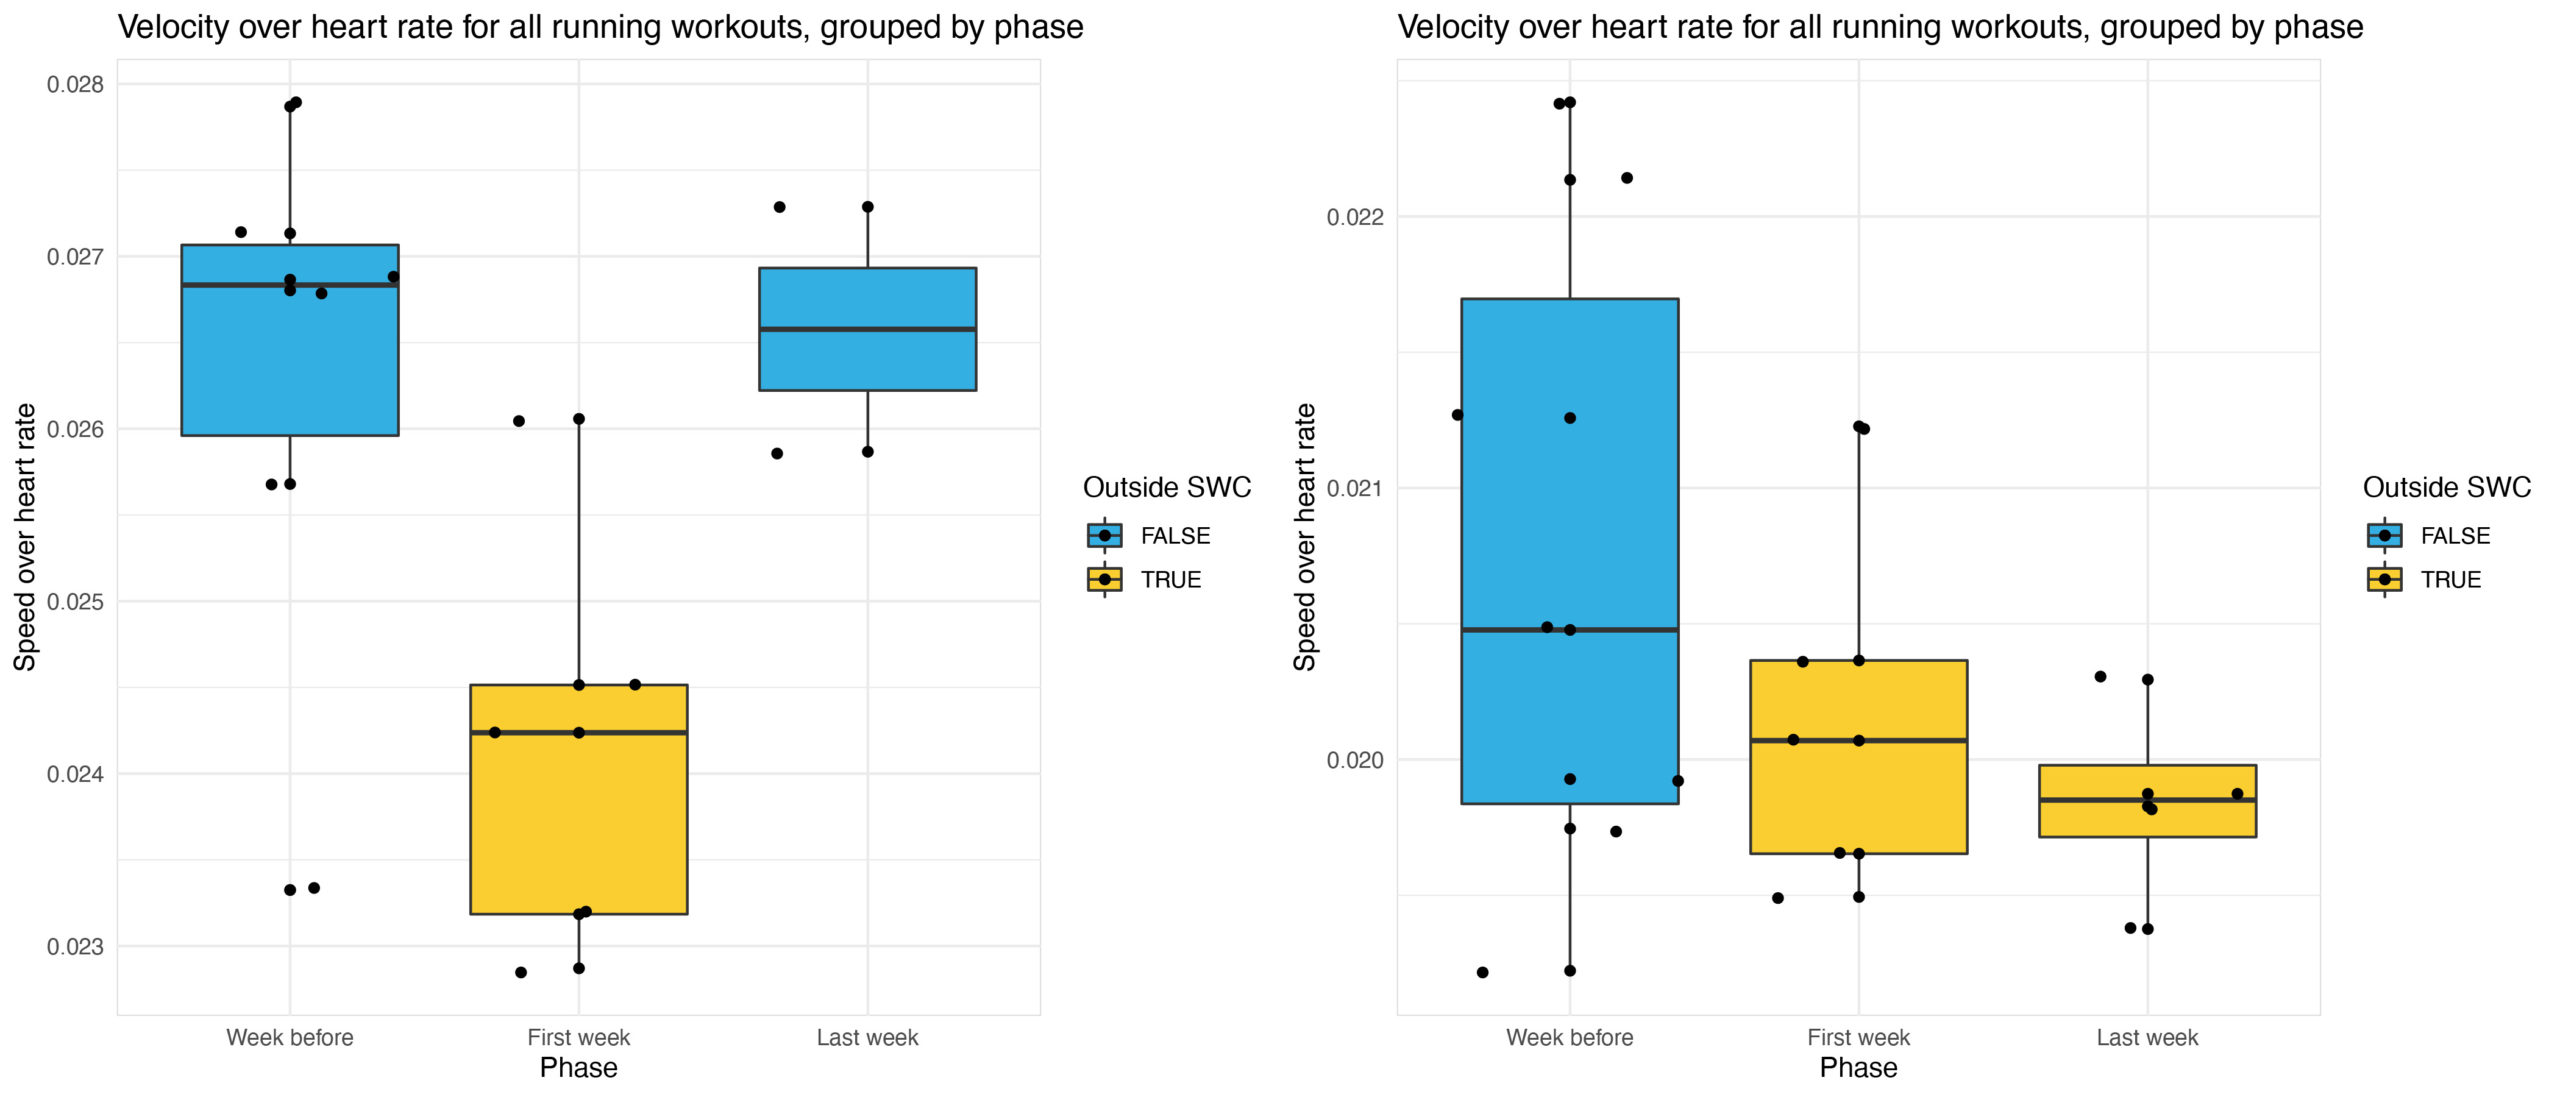
Figure.1 An example of submaximal exercise heart rate data (the velocity to heart rate ratio) for two athletes, grouped by training camp phase and colour-coded according to the weekly average being within or outside of the SWC as computed from the data collected in the week before the camp. The athlete on the left was part of the responder group, as the velocity to heart rate ratio is within the SWC during the last week of the camp. The athlete on the right was assigned to the non-responder group, as the velocity to heart rate ratio remained suppressed, even at the end of the camp. TRUE means that in a given week, the velocity to heart rate ratio was within the SWC of the week before the camp, at sea level. FALSE means that the velocity to heart rate ratio in a given week was outside of the SWC of the week before the camp.
Results
Figure 2 shows an example of daily HR, rMSSD collected for one athlete before and during the training camp at altitude, while Figure 3 shows training load (TSS) before and during the first week of the camp. Figure 4 shows boxplots of the resting HR, rMSSD, and coefficient of variation (CV) rMSSD for the responders and non-responders. Resting HR was more elevated during the first week of the training camp for non-responders (+4.6 ± 1.56 bpm) compared to responders (+0.5 ± 1.2 bpm, Wilcox test: p = 0.0498, 95% CI [-7.54, -2.10], effect size = 0.81, large). The CV rMSSD also increased by a greater extent for non-responders (+11 ± 6 %) than for responders (-3 ± 3%, Wilcox test: p = 0.0571, 95% CI [-0.21, -0.03], effect size = 0.80, large). The difference in rMSSD between pre-camp values and the first week of the camp was lower for non-responders (-11 ± 10 ms) compared to responders (+6 ± 29 ms, Wilcox test: p = 0.6286, 95% CI [-12.77, 70.51], effect size = 0.27, small). As expected, training load did not differ before and during the camp and did not differ between the two groups (Wilcox test: p = 0.4, 95% CI [-476.17, 84.09], effect size = 0.40, moderate). The same athletes responded positively (or negatively) to successive camps.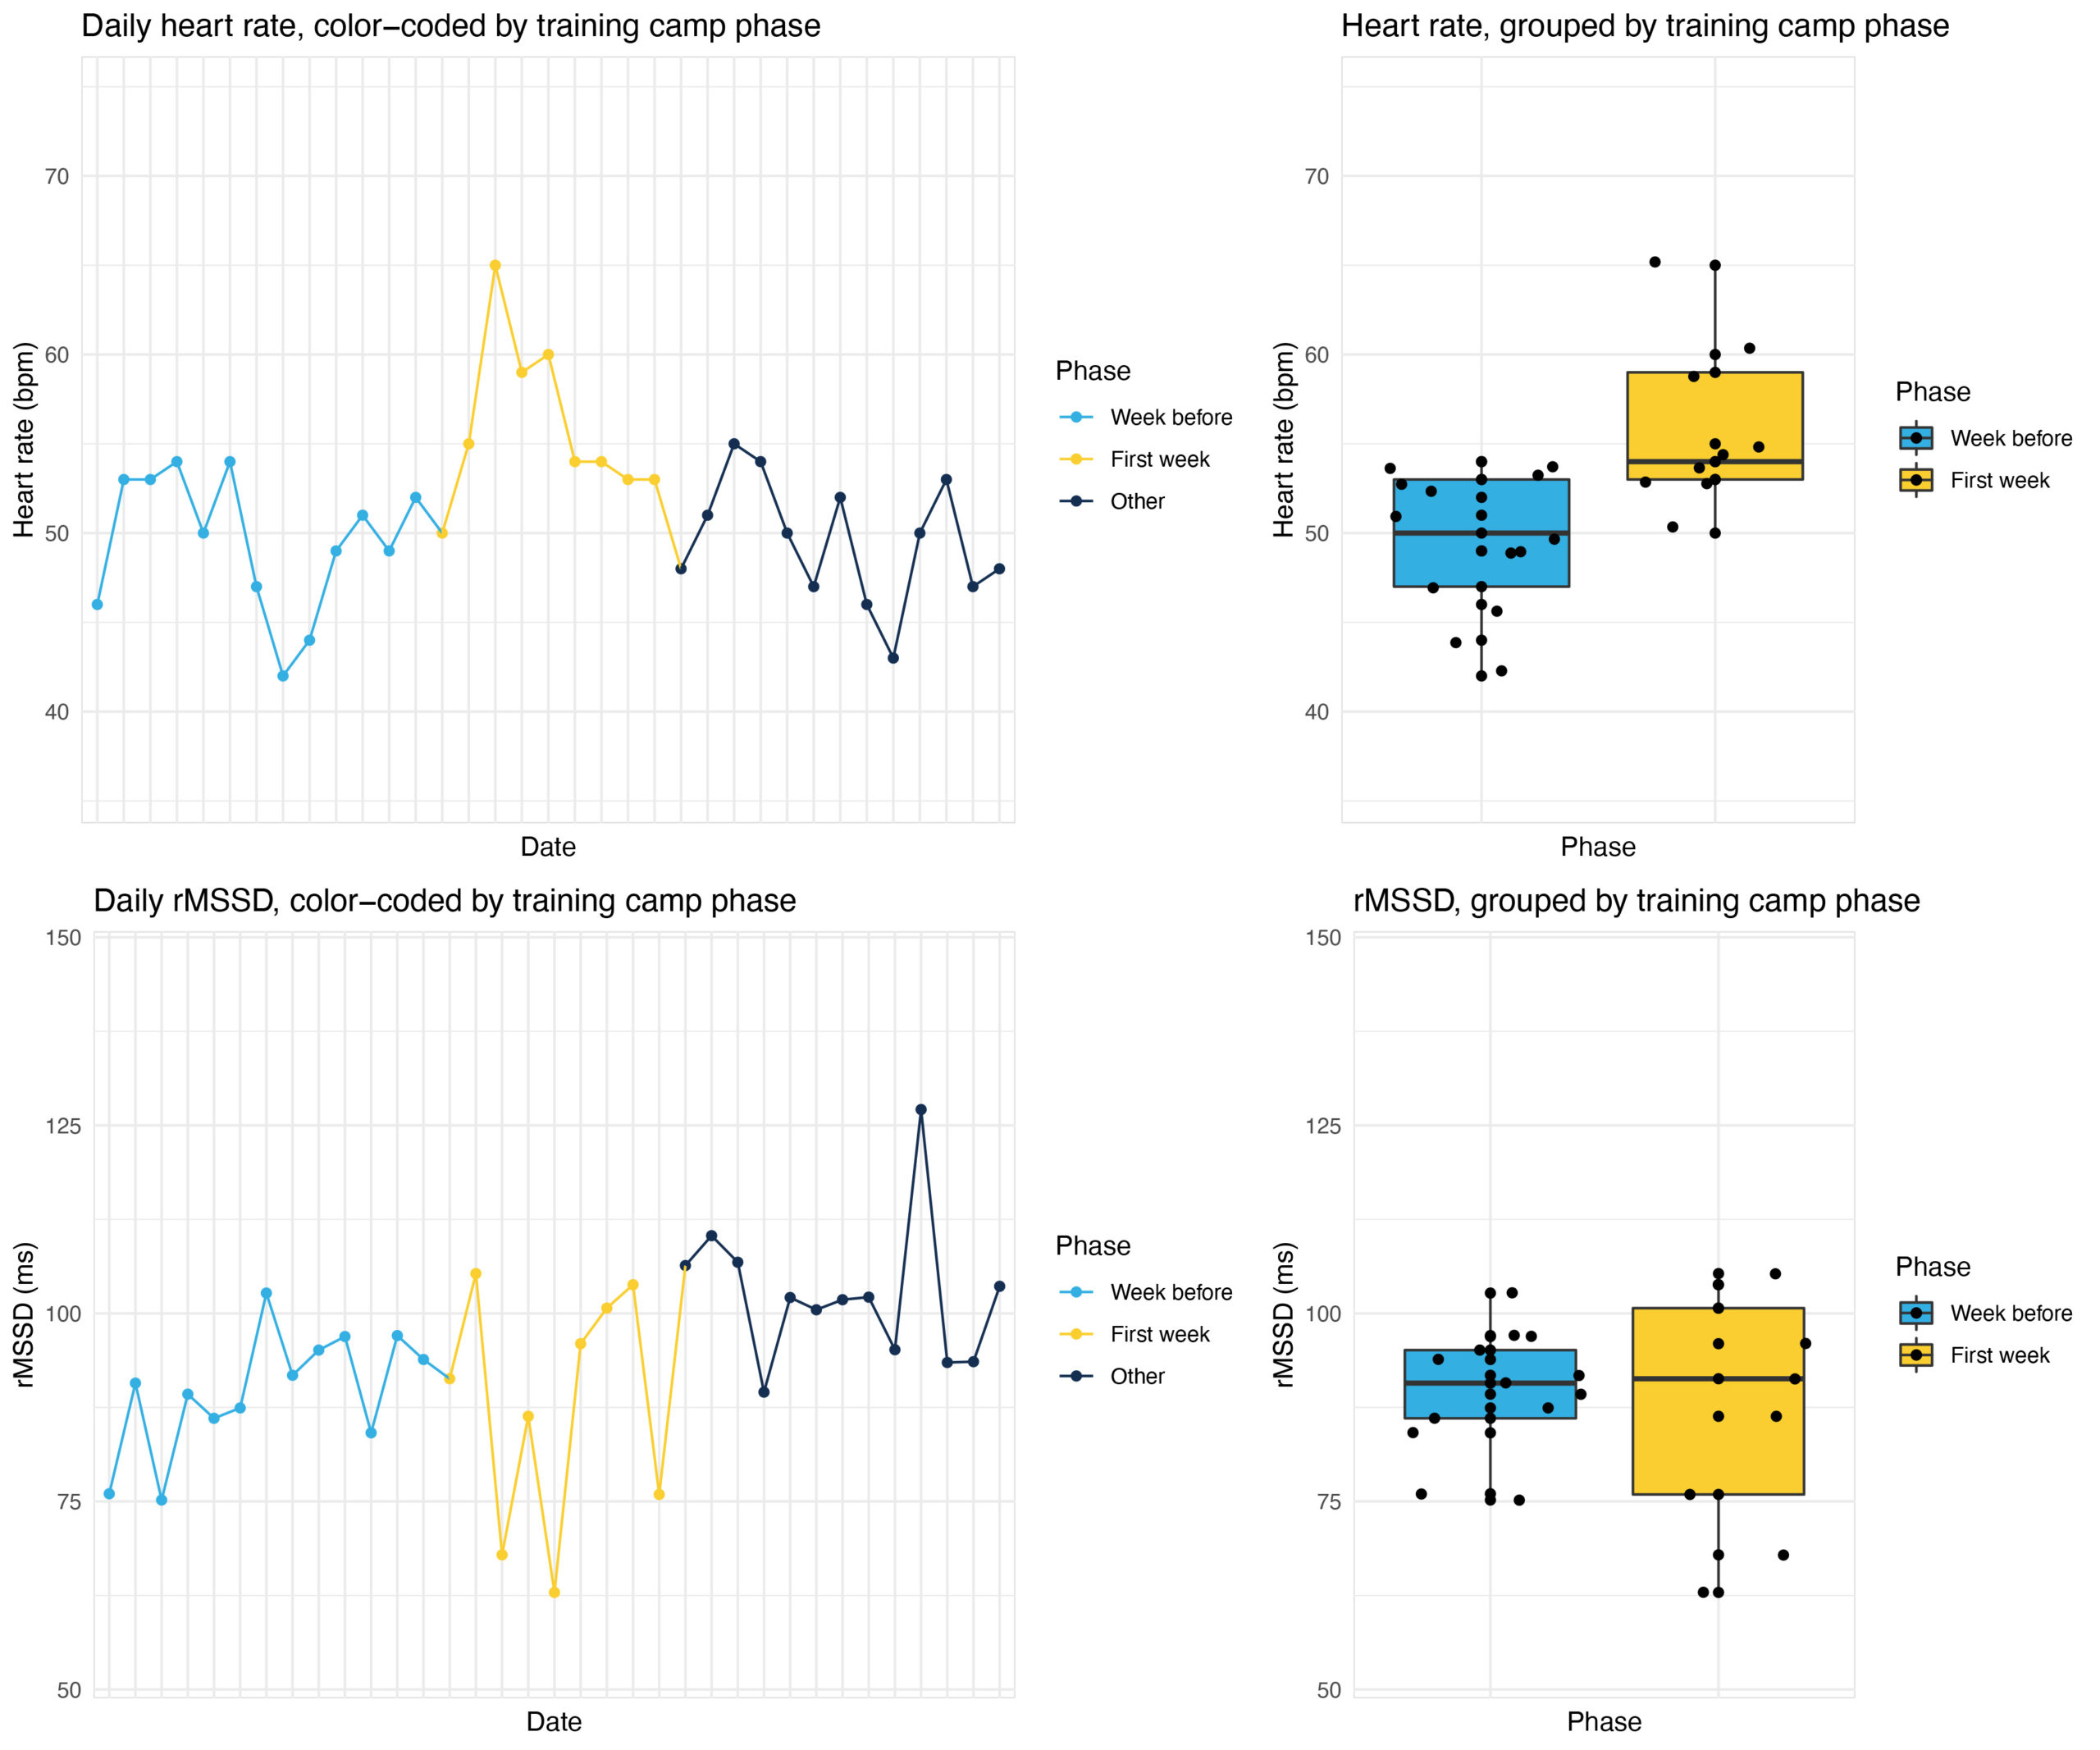
Figure. 2 Example of daily resting HR and HRV (rMSSD) for one athlete, as well as boxplots of the same parameters during the two periods of interest: before the camp and during the beginning of the camp. We can see how resting heart rate increases during the first days of the camp, and then lowers to values similar to the athlete’s values before the camp. Similarly, rMSSD reduces during the first days of the camp, despite normalizing quickly for this athlete, as illustrated by the boxplots showing little difference between the two periods. We can see however how rMSSD spreads over a broader range, and jumps between higher and lower values, as also shown by a wider boxplot. This behaviour is captured by a higher coefficient of variation (CV), or higher day to day variability despite a similar average rMSSD over a period of ten days.
Discussion
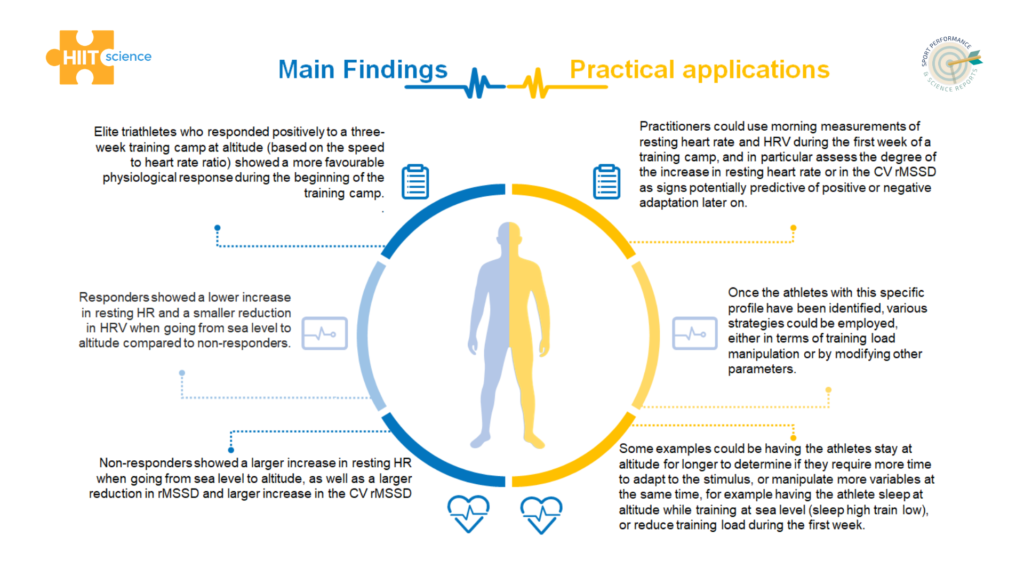
The main finding of this study was that elite triathletes who responded positively to a three-week training camp at altitude (based on the speed to heart rate ratio) showed a more favourable physiological response during the beginning of the training camp.In particular, responders showed a lower increase in resting HR when going from sea level to altitude compared to non-responders.Additionally, responders showed a smaller reduction in HRV and no increase in the CV rMSSD when going from sea level to altitude. Interestingly, non-responders showed a larger increase in resting HR when going from sea level to altitude, as well as a larger reduction in rMSSD and larger increase in the CV rMSSD.
These findings suggest that exacerbated responses in cardiac activity at rest during the first week of a training camp at altitude might be indicative of difficulties adapting to the altitude training stress.
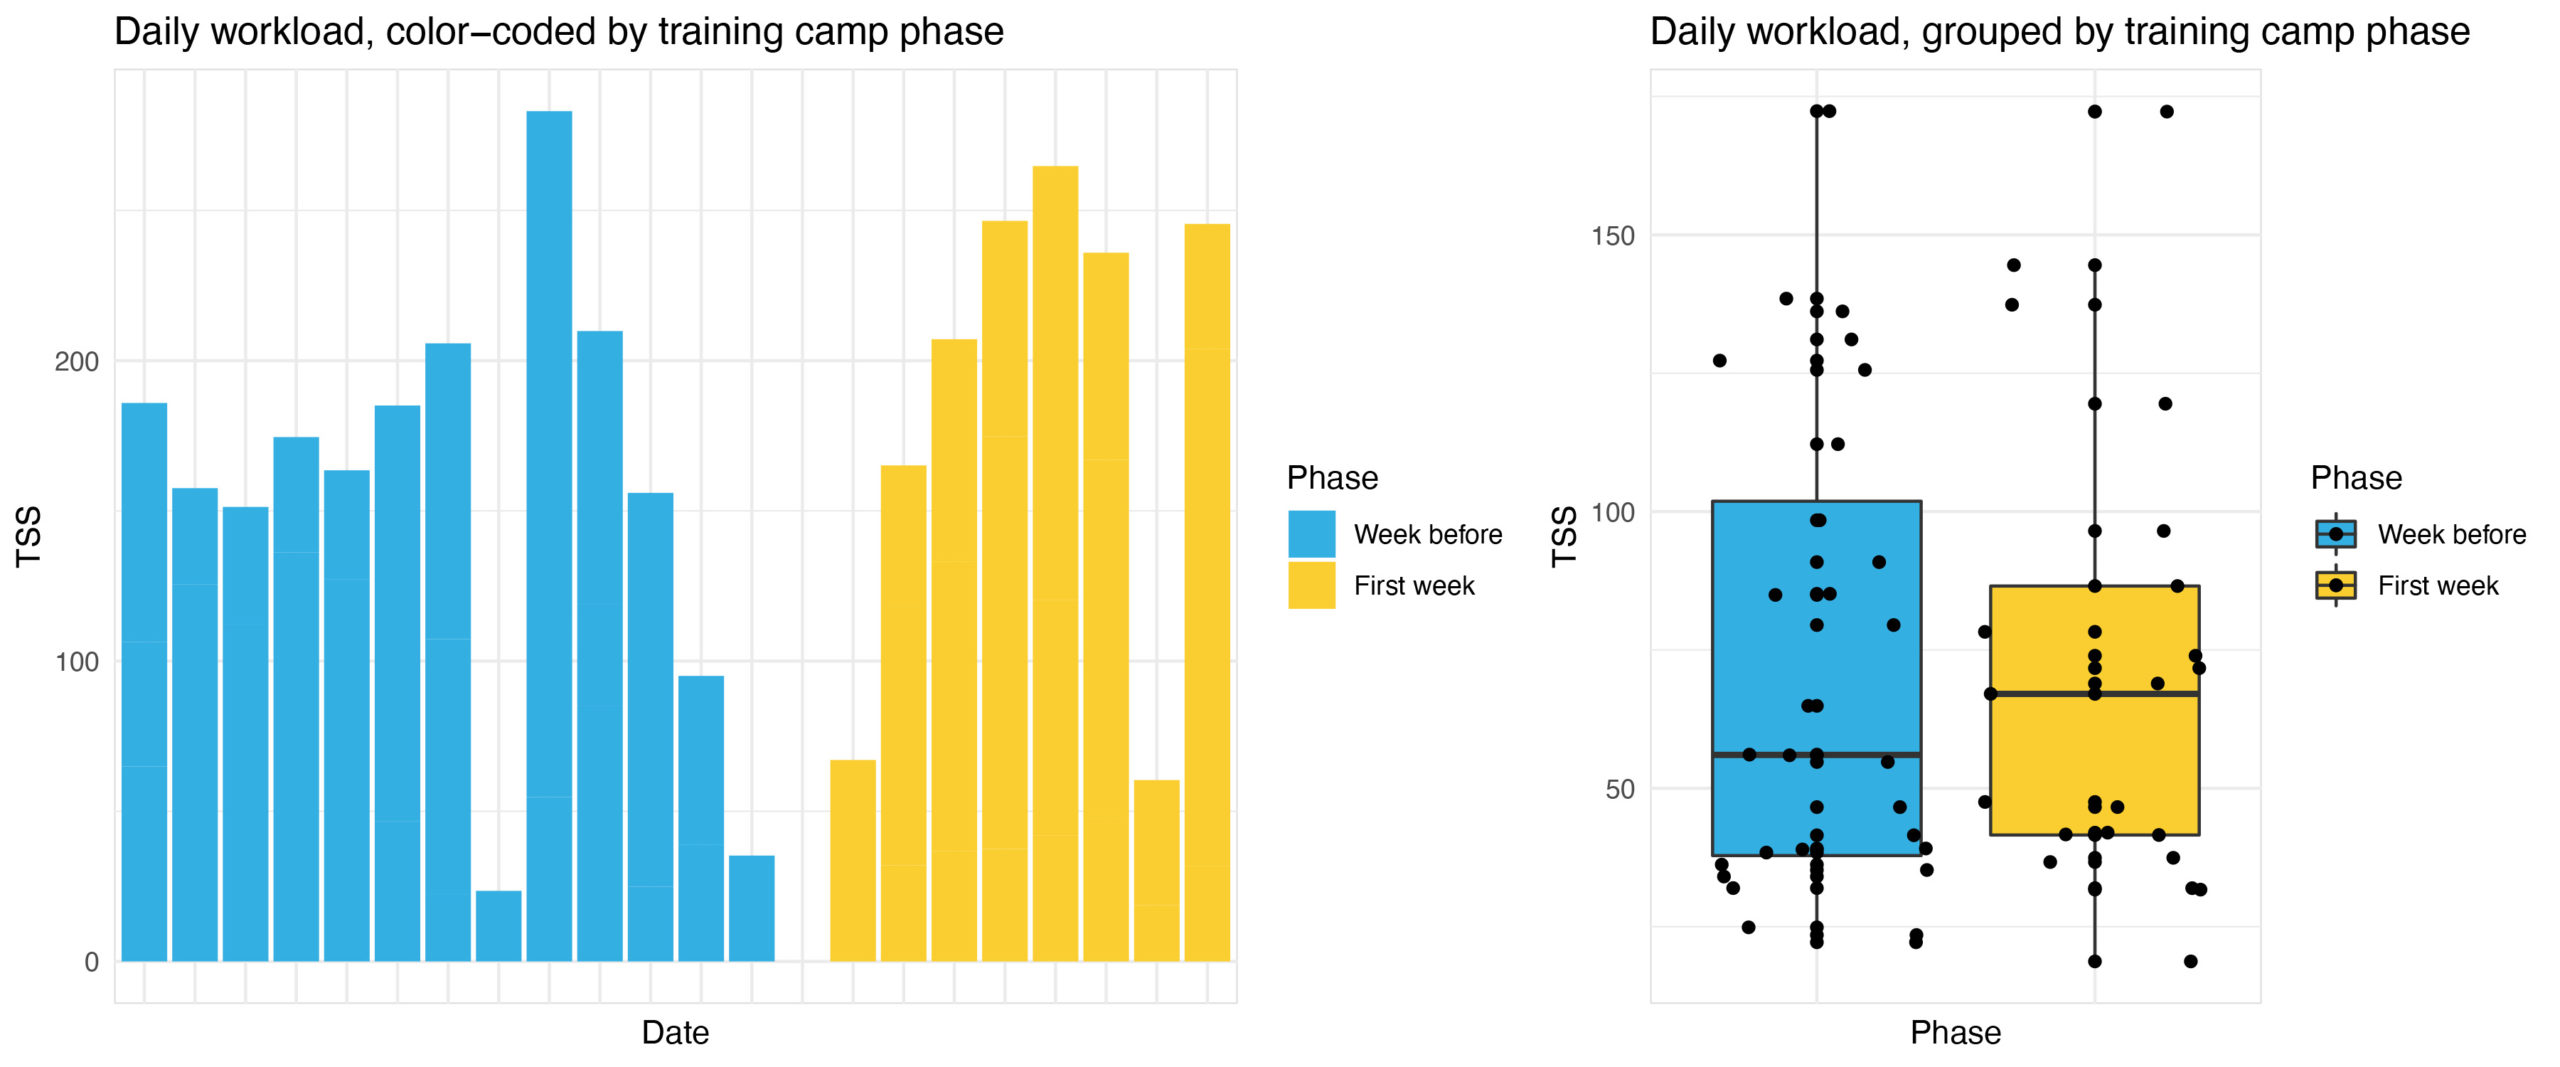
Figure. 3 Example of daily external training load data (TSS) for one athlete, as well as boxplots of the same parameters during the two periods of interest: before the camp and during the beginning of the camp. We can see how training load is similar between the two phases, and most likely is not the main factor behind changes in resting physiology analyzed in this study, which are instead associated with responses to the altitude stimulus.
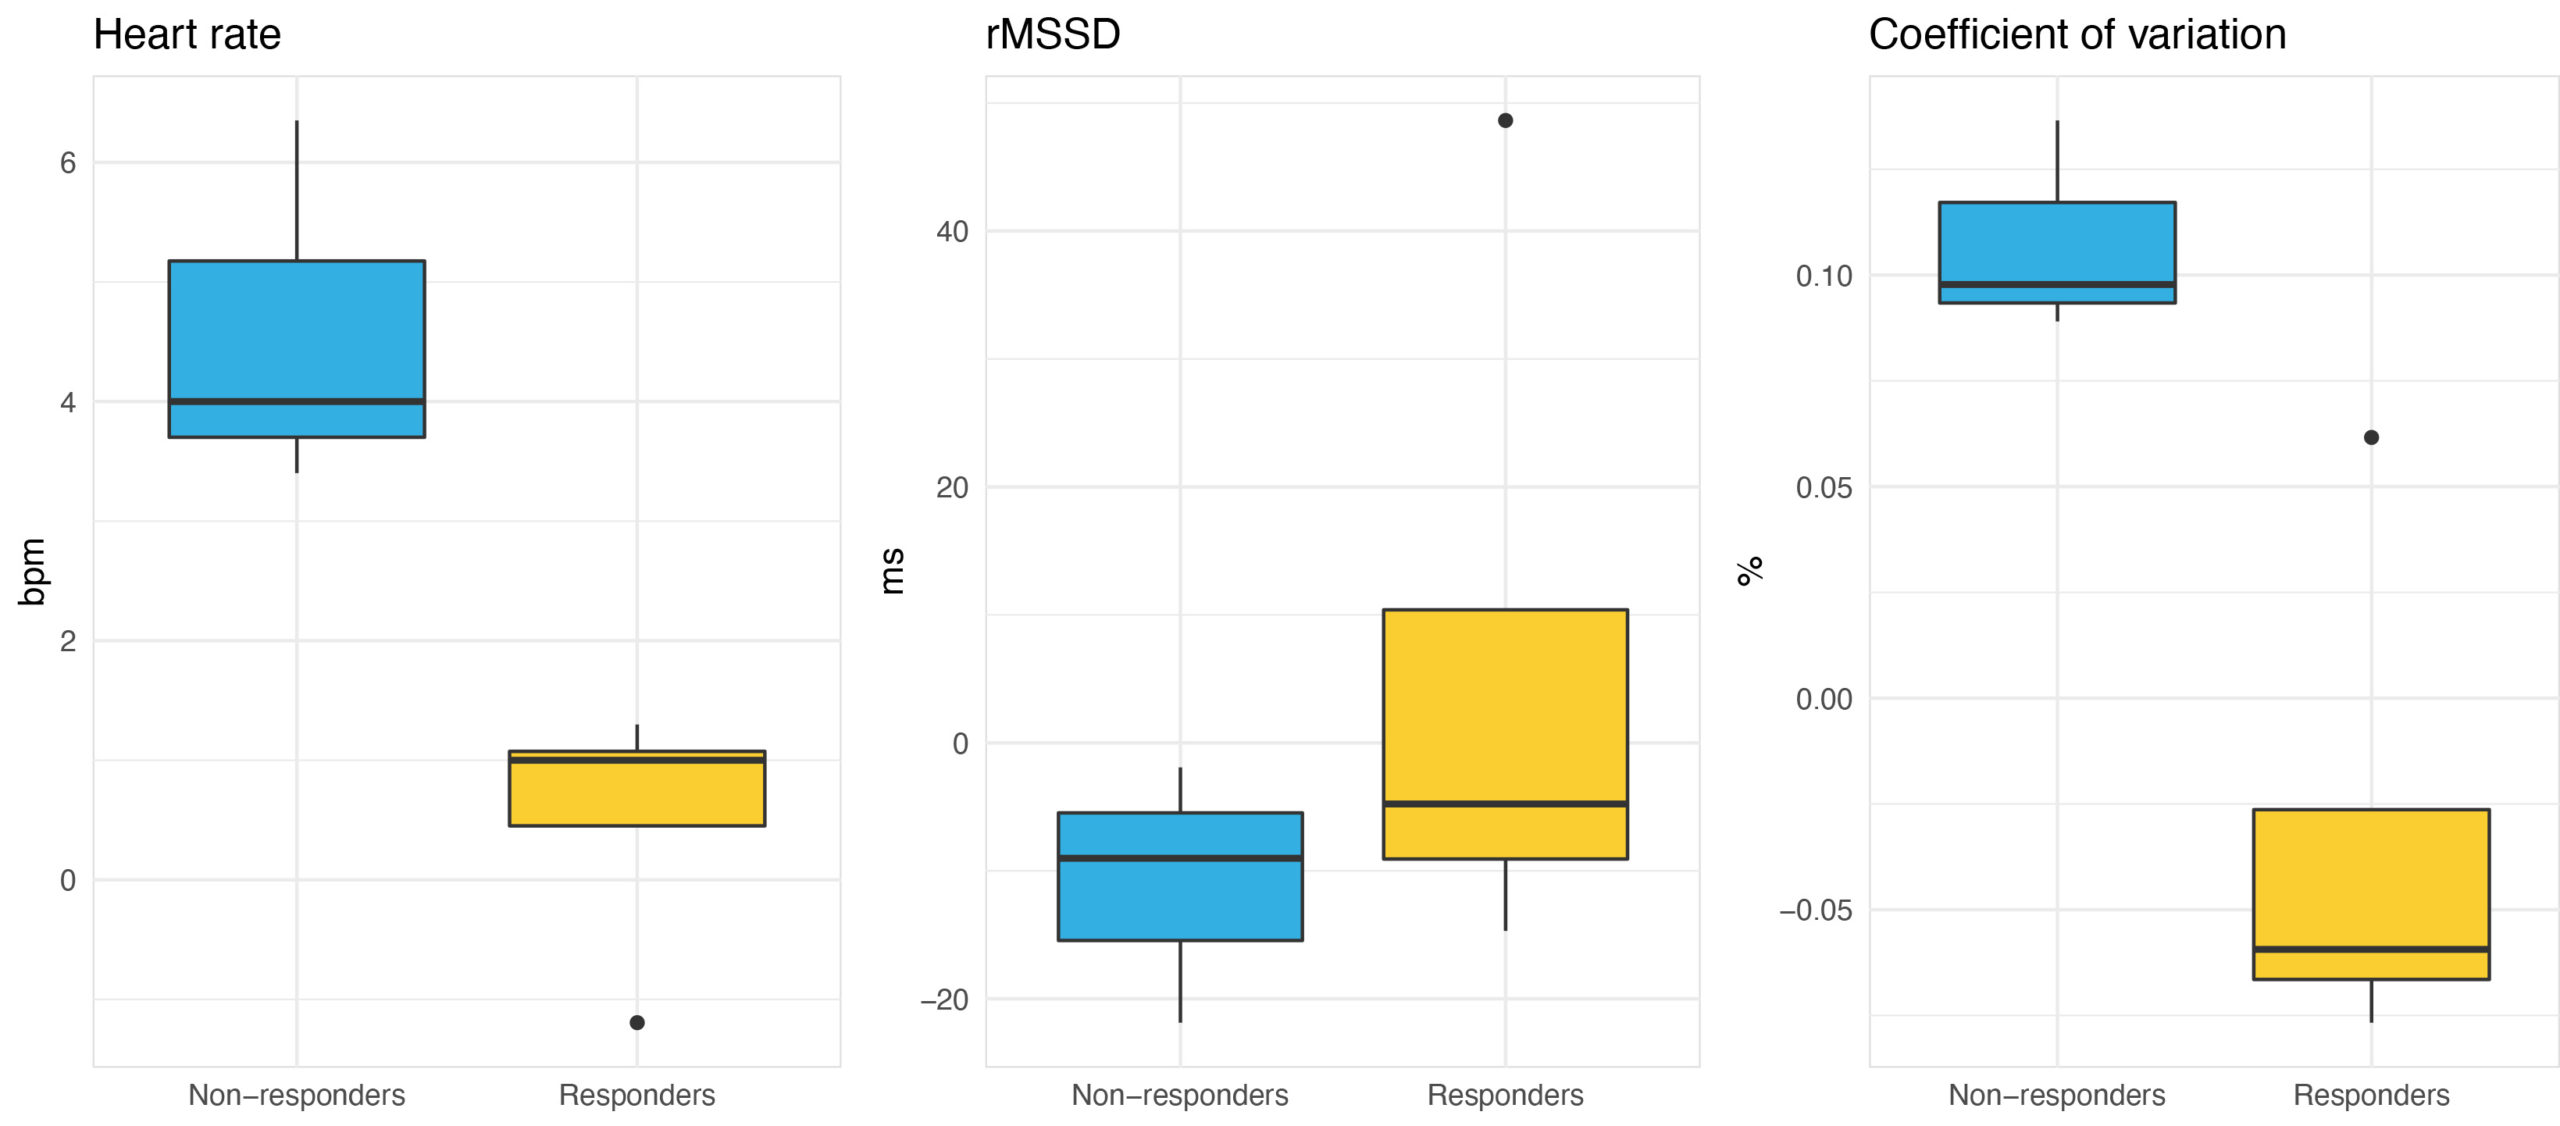
Figure. 4 Boxplots of the differences in resting HR, rMSSD and CV rMSSD between the period prior to the camp and the beginning of the camp in the two groups (responders and non-responders). The figure shows how responders have a more favourable physiological profile (lower increase in resting HR, lower CV).
As we learned from the last two posts on this blog, it is clear both to the experienced coach and the scientist that athletes respond differently to the stimuli provided, and not all benefit in the same way from a given stimulus.The basic principle behind training camps at altitude for endurance athletes is to trigger an increase in the aerobic stimulus to improve endurance capacity following subsequent adaptation. However, as we just saw, responses to training at altitude vary.Some athletes might adapt to the novel stimulus and improve, while others might struggle or require more time to adapt (14, 15). We speculate that a better response to the altitude training camp may be due to a relatively lower physiological stress encountered (or perceived by the athlete), resulting in a more stable HRV profile (i.e. a lower CV). Flatt argued that a lower CV possibly indicates a reduced perturbation in homeostasis, and therefore athletes showing increased CV might benefit from a reduced training load (20). As per the last two blog posts, muscle fiber typology might be another factor involved. In another study, Flatt and colleagues reported a strong relationship between the degree of change in the CV and the fitness level measured in a performance test; that is, players showing a larger decrease in the CV during the first 2 weeks of the training camp experienced greater performance improvements post-training camp (20). In our study, we could make similar assumptions. In particular, the altitude challenge was evident in all athletes during the first days of the training camp, both in resting and workout data, with typical responses such as elevated HR while running and at rest. However, the data suggests that the degree of the disruption in homeostasis was greater for certain athletes and that these athletes were the ones that eventually did not appear to adapt (well) to the training camp.
Limitations
A limitation of this study is the small sample size. Unfortunately working with a small sample size is typical of elite settings where, by definition, only a few athletes make it to the top. Another potential limitation of the study is the use of real-life field-based data instead of laboratory tests to determine adaptation to the training camp according to submaximal data and the velocity to heart rate ratio. However, using data collected in unconstrained free-living settings has several advantages. First, no specific tests are required. Second, individual data points might be affected by various confounding factors, starting with the day to day variability in heart rate. Finally, using field-based workouts and pooling several days of data might in fact be a more robust strategy to determine training adaptation.Recommendations for practitioners and researchers
About the author
 Marco Altini is the Founder of HRV4Training, Data Science Advisor at Oura and Guest Lecturer at VU Amsterdam.
Marco holds a PhD in Machine Learning and two MSc: Human Movement Sciences and Computer Science Engineering.
Twitter: @altini_marco
Marco Altini is the Founder of HRV4Training, Data Science Advisor at Oura and Guest Lecturer at VU Amsterdam.
Marco holds a PhD in Machine Learning and two MSc: Human Movement Sciences and Computer Science Engineering.
Twitter: @altini_marco
References
- Jeukendrup, AE and Hesselink, MKC and Snyder, AC and Kuipers, H and Keizer, HA. Physiological changes in male competitive cyclists after two weeks of intensified training. International journal of sports medicine, pp. 534—541, 1992.
- Plews, Daniel J and Laursen, Paul B and Stanley, Jamie and Kilding, Andrew E and Buchheit, Martin. Training adaptation and heart rate variability in elite endurance athletes: opening the door to effective monitoring. Sports medicine, pp. 773—781, 2013.
- Buchheit, Martin. Monitoring training status with HR measures: do all roads lead to Rome?. Frontiers in physiology, 2014.
- Stanley, Jamie and Peake, Jonathan M and Buchheit, Martin. Cardiac parasympathetic reactivation following exercise: implications for training prescription. Sports medicine, pp. 1259—1277, 2013.
- Dressendorfer, Rudolph H and Wade, Charles E and Scaff Jr, Jack H. Increased morning heart rate in runners: a valid sign of overtraining? The Physician and sportsmedicine, pp. 77—86, 1985.
- Altini, Marco and Amft, Oliver. HRV4Training: Large-scale longitudinal training load analysis in unconstrained free-living settings using a smartphone application. IEEE 38th Annual International Conference of the IEEE Engineering in Medicine and Biology Society (EMBC). pp. 2610—2613, 2016.
- Pichot, Vincent and Roche, Frederic and Gaspoz, Jean-Michel and Enjolras, Franck and Antoniadis, Anestis and Minini, Pascal and Costes, Frederic and Busso, Thierry and Lacour, Jean-Rene and Barthelemy, Jean Claude. Relation between heart rate variability and training load in middle-distance runners. Medicine & Science in Sports & Exercise, pp. 1729—1736, 2000.
- Flatt, Andrew A and Esco, Michael R. Smartphone-derived heart-rate variability and training load in a women’s soccer team . International journal of sports physiology and performance, pp. 994—1000, 2015.
- Plews, Daniel J and Laursen, Paul B and Le Meur, Yann and Hausswirth, Christophe and Kilding, Andrew E and Buchheit, Martin. Monitoring training with heart-rate variability: How much compliance is needed for valid assessment? International journal of sports physiology and performance, pp. 783-790, 2014.
- Esco, M. R., Flatt, A. A., & Nakamura, F. Y. Initial weekly HRV response is related to the prospective change in VO2max in female soccer players. International journal of sports medicine, Vol. 37, 2016.
- Buchheit, Martin, A. Chivot, J. Parouty, D. Mercier, H. Al Haddad, P. B. Laursen, and S. Ahmaidi. Monitoring endurance running performance using cardiac parasympathetic function. European journal of applied physiology, pp. 1153-1167, 2010.
- Plews, Daniel J., Paul B. Laursen, Andrew E. Kilding, and Martin Buchheit. Evaluating training adaptation with heart-rate measures: a methodological comparison. International journal of sports physiology and performance, Vol. 8, 2013.
- Vesterinen, V and Hakkinen, K and Laine, T and Hynynen, E and Mikkola, J and Nummela, A. Predictors of individual adaptation to high-volume or high-intensity endurance training in recreational endurance runners. Scandinavian journal of medicine & science in sports, pp. 885-893, 2016.
- Fulco, Charles S and Rock, Paul Bernard. Maximal and submaximal exercise performance at altitude. Aviation Space and Environmental Medicine, pp. 793-801, 1998.
- Friedmann-Bette, B. Classical altitude training. Scandinavian journal of medicine & science in sports, pp. 11-20, 2008.
- Buchheit, Martin, Ben M. Simpson, Walter F. Schmidt, Robert J. Aughey, Rudy Soria, Robert A. Hunt, Laura A. Garvican-Lewis, David B. Pyne, Christopher J. Gore, and Pitre C. Bourdon. Predicting sickness during a 2-week soccer camp at 3600 m (ISA3600). British Journal of Sports Medicine, Vol. 47, 2013.
- Taralov, Zdravko Z and Terziyski, Kiril V and Kostianev, Stefan S. Heart rate variability as a method for assessment of the autonomic nervous system and the adaptations to different physiological and pathological conditions. Folia medica, pp. 173-180, 2016.
- Rusko, Heikki R. New aspects of altitude training. The American journal of sports medicine, pp. S48-S52, 1996
- Buchheit, M., Simpson, B.M., Garvican-Lewis, L.A., Hammond, K., Kley, M., Schmidt, W.F., Aughey, R.J., Soria, R., Sargent, C., Roach, G.D. and Claros, J.C.J. Wellness, fatigue and physical performance acclimatisation to a 2-week soccer camp at 3600 m (ISA3600). British journal of sports medicine, Vol. 47, 2013.
- Flatt, Andrew A and Esco, Michael R. Evaluating individual training adaptation with smartphone-derived heart rate variability in a collegiate female soccer team. The Journal of Strength & Conditioning Research, pp. 378-385, 2016.
- Plews, Daniel J and Scott, Ben and Altini, Marco and Wood, Matt and Kilding, Andrew E and Laursen, Paul B. Comparison of heart-rate-variability recording with smartphone photoplethysmography, Polar H7 chest strap, and electrocardiography. International journal of sports physiology and performance, pp. 1324-1328, 2017.
- Altini, Marco. HRV4Training. HRV4Training.com. [Online] 2013. https://www.hrv4training.com/.
- Bärtsch, P., & Saltin, B. General introduction to altitude adaptation and mountain sickness. Scandinavian journal of medicine & science in sports, Vol. 18, 2008.
- Naeije, Robert. Physiological adaptation of the cardiovascular system to high altitude. Progress in cardiovascular diseases, Vol. 52, 2010.
- Hopkins, W., Marshall, S., Batterham, A., & Hanin, J. Progressive statistics for studies in sports medicine and exercise science. Medicine & Science in Sports & Exercise, Vol. 41, 2009.
- Spencer, M., Losnegard, T., Hallén, J. and Hopkins, W.G. Variability and predictability of performance times of elite cross-country skiers. International Journal of Sports Physiology and Performance, Vol. 9, 2014.